This week’s Digital Pedagogy workshop, “Where It’s At: Basic Digital Maps for Your Class,” will occur Tuesday, October 13, from 4:30–5:30 pm, with a repeat on Wednesday, October 14, from 11:00 am–noon. The location is the library computer lab (Abell 208).
Most of us are used to getting driving directions and other geographical information from digital applications on our devices. But you may not have thought as much about how mapping projects can be effective elements of teaching and learning. Now, sometimes we use the term “map” in a broader sense to refer to any representation of content in graphical form; thus there are “mind maps” and “concept maps,” for example. But in the more specific sense, maps are used to present data and information that can be connected to spatial coordinates of latitude and longitude. Across the curriculum there are many possibilities for visualizing content with maps, bringing about deeper insights and more effective learning in the subject matter.
The term “Geographical Information Systems” (GIS) refers to the category of applications and practices involved in mapping projects. These projects, and the associated tools needed to produce them, range widely in complexity. The most commonly used professional GIS tool is ArcGIS, which is installed on computers in a number of workstation areas here at Austin College, including the library and the Idea Center. One of our Mellon grant recipients, political science professor Don Rodgers, is leading a project that utilizes ArcGIS in the Social Entrepreneurship for Poverty Alleviation (SEPA) initiative, a collaborative venture between Austin College and the Texoma Council of Governments.
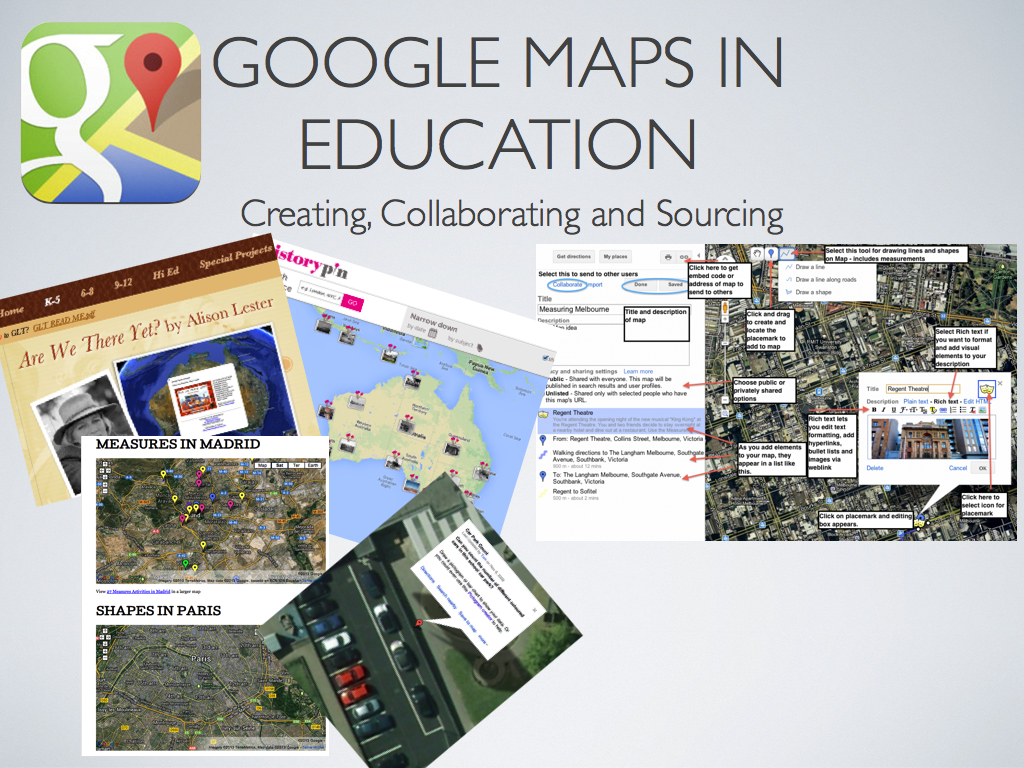
While ArcGIS is the current standard for GIS software, its use involves a significant level of training and cost. Fortunately, there are more accessible resources at hand if you are interested in incorporating mapping projects and assignments in your courses. For starters, there’s Google Maps (and Google Earth), which is more than just a navigational app on your phone. As Adeline Koh recently observed in an article on digital pedagogy,
Starting with Google Maps to integrate digital humanities [and other liberal arts] in the classroom is relatively painless, easy and free. The tool is easy to navigate, and as many students are already familiar with the Google interface, this familiarity helps them to get to the meat of the assignment more quickly. Instructors interested in exploring mapping projects should thus probably start with this tool. While much more sophisticated projects involving GIS and visualization software are possible, they require considerably more investment in terms of course time and resources.
Another application that is free to use and worth considering is Story Maps, created by ESRI, the same company behind ArcGIS. Story Maps offers a wide range of attractive mapping features; for an extensive gallery of projects created with Story Maps, peruse their gallery of showcase projects, organized by topic.
Both Google Maps and Story Maps allow you to embed narrative text, images, and mulitmedia content into a mapping platform in order to create rich spatial visualizations of your material. The projects can be created collaboratively, thus giving rise to the practice of “social mapping.” For one interesting example of an ongoing collaborative social mapping enterprise, check out some of the projects at Historypin.org.
At this week’s session, we’ll brainstorm ideas for incorporating mapping projects in your class and work together on a simple project that will demonstrate how you can use some of these basic mapping tools. Looking forward to seeing you there.
Curated Resources
- William Fenton, “What Digital Mapping Projects Reveal About Higher Education“; “5 Digital Mapping Projects that Visualize History“; “5 Digital Mapping Projects that Visualize Literature” (all 2015)
- Adeline Koh, “Introducing Digital Humanities Work to Undergraduates: An Overview” (2014)
- Google Maps for Education
- “Teaching with Google Earth“
- “Teaching History with Google Maps“
- Mapping Texts
- Texas Slavery Project
- Story Maps
- Historypin
- Grayson County Historical Markers
- Workflow for Using ArcGIS (free public online account) and Story Maps Journal