More Maps–Further Explorations with ArcGIS Online

screen-shot-2016-09-26-at-1-02-15-pmSo far this month we’ve explored how to create digital pedagogy projects using both Google My Maps and Story Maps Journal. This week we’ll conclude our month of focusing on spatial literacy and digital mapping with a more in-depth introduction to GIS, or Geographical Information Systems. Specifically, we’ll discuss what you can do with a free public account at ArcGIS Online.

ArcGIS, the most widely used resource in digital mapping, is actually a suite of applications of varying degrees of accessibility and complexity. The desktop version of the program is installed in a number of the computer labs at Austin College. The web-based version, ArcGIS Online, is accessed through a browser. There are subscription-based organizational accounts, but also a free version that is referred to as a “public” account. Though some of the advanced analytic and visualization feature are only available via subscription, the free public account offers a quite robust set of features that is worth becoming familiar with. The Story Maps journal application is one such feature. However, there are many other ways that you can incorporate maps and spatially-referenced content into your teaching and research outside of the Story Maps platform. We’ll take some time in this week’s workshops for conversation and exploration of some possibilities.

Meanwhile, here’s a quick start guide on using ArcGIS Online with a free public account:

Loader Loading...
EAD Logo Taking too long?

Reload Reload document
| Open Open in new tab

Creating Compelling Narratives with Story Maps

We continue September’s focus on spatial literacy and digital maps with an exploration this week of the “Story Maps” application from ArcGIS.

Story Mapsscreen-shot-2016-09-12-at-3-38-09-pm 
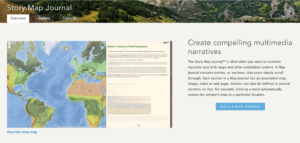
is a multimedia web mapping application that joins text, audio, video, photographs, and thematic and base map in a compelling environment that is perfect for communicating the results of any investigation from local to global in scale. It functions as both a content management system and a presentation platform for projects that incorporate maps and the layers of content that can be placed upon them. Story Maps can be used with any topic that references geographical coordinates or place-based information, which means that it has potential applications in practically every discipline of the academic curriculum.

Here at Austin College, English professor Tom Blake is incorporating the Story Maps platform into his ENG 331 course, “Global Middle Ages.” Tom is a Mellon grantee, and described the objectives for this project in his grant application:

My English 331: Global Middle Ages course in many ways will develop and expand DH assignments from previous courses. Serving as a global literature requirement for the English major, this course seeks to help students see medieval literature as less exclusively European and/or English and more global and cross-cultural. A core theoretical lens of this course is postcolonial theory, and a digital mapping project would imbue students with the tools to tell stories of international and cross-cultural transmission. Specifically, this course could benefit from a DH tool suited to highlighting through map and story the international journey of narrative.

In the past, I have used WordPress blogs effectively as a way for students to track medieval issues and themes to the modern day blending texts, images, and videos. However, Global Middle Ages presents unique challenges that would benefit from a more spatially and geographically oriented DH platform.

Tom’s students will be developing their projects according to the following guidelines (which he is still tweaking):

Tom’s students are just beginning to select their topics and to start the research process. We’ve introduced them to Story Maps Journal in an in-class presentation, and I’ll continue to work with the small groups as they build their projects. In the digital pedagogy workshops this week, I’ll highlight this application, and we’ll discuss the issues involved in developing this kind of assignment.

For now, to gain a sense of what Story Maps can do, browse this gallery of projects that have been created using its various templates. You can filter and search by topic to see projects across a range of subjects and scope. Story Maps has several different layouts; the one called “Story Maps Journal” is, to my mind, the most full-feature and is what I generally recommend for digital pedagogy projects. One example from the gallery that I like to point folks to for a demo is “The Amazonian Travels of Richard Evans Schultes.” As the project describes him,

Schultes – ethnobotanist, taxonomist, writer and photographer – is regarded as one of the most important plant explorers of the 20th century. In December 1941, Schultes entered the Amazon rainforest on a mission to study how indigenous peoples used plants for medicinal, ritual and practical purposes. He would follow in the tradition of great Victorian era explorers, spending over a decade immersed in near-continuous fieldwork. In total, Schultes would collect more than 24,000 species of plants including some 300 species new to science.

Story Map Journal projects are organized into distinct sections–you can think of them as slides, pages, modules, what have you–with each section composed of a “main stage” and a “side panel.” Each of these spaces can contain various forms of content. Typically, maps are presented on the main stage, and associated material–text, images, video, links, etc.–is presented in the side panel and associated with specific content on the map, such as a pinned location or a shaded region. The side panel can also contain links that trigger actions on the main stage; for example, zooming or panning the map, or opening a pop-up box with further information.

Here’s a screengrab from the Schultes project, showing a section of the story highlighting his initial forays into the northwest Amazon:

screen-shot-2016-09-12-at-2-41-36-pm

The map in the main stage is layered with markers showing the locations of Schultes’s important research expeditions and discoveries in the northwest Amazon. The side panel incorporates explanatory text and photos. I’ve clicked on one of the markers, which displays a pop-up panel with further information and links (which open in a new browser tab). At the far left you can see the basic navigation tool, allowing movement among the project sections; in addition, viewers can simply scroll down the side panel to advance the project.

Further in this same section of the project, the viewer can change the main stage view by clicking on, for example, “View Map of the Rio Negro Watershed.” The map zooms to the appropriate scale and region, and a shaded layer is turned on to indicate the desired area:

screen-shot-2016-09-12-at-2-46-52-pm

This project is a good example that uses maps created from contemporary cartographic renderings. In this case, the “National Geographic” layout was used as the base map to represent the regions in which Schultes carried out his explorations.

In other cases, projects may need to access maps from different historical eras, which obviously represent places according to the political and cultural realities of the times. For example, in the Story Maps Journal project, “Copernicus and His Universe,” an early 16th c. European map is used, quite appropriately, as the base map for visualizing important locations in the life and work of the Polish astronomer.

screen-shot-2016-09-12-at-3-01-02-pm

The then-current political situation is represented, along with stylized markers that open as pop-up boxes (clicking a link in the side panel text zooms the map and opens up a specific content box). Again, knowledge is constructed and presented in a visually rich way that helps students to consolidate their understanding of the geographic dimensions of the given topic.

In many cases, we may already have access to a map that might be useful in a project, but only in the form of an image file or a scan. That is likely to be the case especially with vintage and historical maps as well as other more unusual maps. Such images are limited in their applicability; they can be placed into a project, but cannot be dragged, panned, and zoomed like a true map file. In addition, they can’t be marked up with content layers, such as pins. Fortunately, there is a process called “georeferencing” that can be applied to these images to turn them into a map file. This would be analogous to using optical character recognition with a scanned text, which then makes that text editable, searchable, etc. There are online repositories (for example, Old Maps Online, The Dave Rumsey Map Collection, and The New York Public Library Map Collection) that contain both map images and georeferenced maps, many of which are open access, others of which may be licensed or purchased.

We envision that Tom’s students will be drawing on some of these resources for their historically-oriented projects. We look forward to presenting our own gallery of Story Map projects from the Global Middle Ages!

Using Google My Maps For Digital Stories

Google-Maps-Drop-PinTo start off digital mapping month at #ACDigPed, we’re learning about Google My Maps and thinking about how it can be used in digital pedagogy projects. Presumably, most all of you have used the basic Google Maps service with your mobile GPS or in your browser. However, you’re probably not familiar with My Maps and how it draws on, though is distinct from, the main Maps application. My Maps allows you to build a customized map with markers for points of interest and popups/side panels to let you add text and imagery connected to each site. So if you have a project in which you want students to become familiar with a set of locations and to build a knowledge base around those locations, My Maps is a user-friendly way to accomplish that. And the maps that you build connect back to the robust capability of Google Maps itself, with access to features such as street view, earth view, 3D perspective, geo-tagged image galleries, and more.

For an example of how My Maps is being used at Austin College, let’s take a look at a project that Terry Hoops is developing in his freshman seminar (C/I) class, Restless Wanderings. Musings on Travel and the Human Condition. The class is beginning the semester by reading Bruce Chatwin’s travelogue, In Patagonia. Terry and the class have identified some two dozen locations referenced by Chatwin for further investigation. The project description states that

Our aim, for this project, is to write as a class a travel guide to the geographical Patagonia that Chatwin wandered through and to the Patagonia in Chatwin’s narrative. We will do this using the Story Map program by ArcGIS. Here’s how we will do it: each group/partnership will select some of the places Chatwin visited and use Story Map to delve into Chatwin’s descriptions and stories. Your entries should give our readers some sense of the places Chatwin visited, and then, gleaning materials from Chatwin’s descriptions and stories, provide a sense of the significance the author gave to that place.

The class is using another mapping application, Story Maps Journal (about which more in the weeks to come) for the main project platform, but the base map is being developed in Google My Maps (and will then be embedded in Story Maps Journal).

The main view of the base map looks like this (you can check out the full interactive version here).

Screen Shot 2016-09-05 at 9.05.59 PM

Each site has a pop-up that zooms the map to the appropriate location and opens the corresponding side panel. So, for example, clicking on the second site, Viedma, takes us here:

Screen Shot 2016-09-05 at 9.17.28 PM

We’re in view mode here (not editing mode); you can see that the side panel has modules to add both textual description and photos/images. The map has basic zoom/pan controls and can be dragged and recentered. But notice also the “View in Google Maps” link in the panel; that allows us to easily access the full functionality of the main Google Maps application. Clicking on that link, and then choosing satellite view and opening the image gallery gives us this:

Screen Shot 2016-09-05 at 9.33.49 PM

Now we have access to resources such as geotagged images, street view, and 3D tilting, among others. Students can tap into this trove of assets to visually explore the location and to gain a better sense of its natural and human-made topography. These resources can then complement the further materials that students will construct based on their wider research of each location. Narratives and multimedia elements for this project will be combined with the My Maps base map in the Story Maps Journal platform, as noted above. As groups of students fill out detailed background for each location of Chatwin’s journey, the full story of his travels will come more richly into view. Follow along at the main Story Map project site.

Screen Shot 2016-09-05 at 9.43.38 PM

So at this week’s workshop we’ll learn how to build a base map in My Maps and have some conversation about possible applications within our own disciplines.

A Story Maps Journal Example–Grayson County Historical Sites

This week in the digital pedagogy workshop we learned about Story Maps, a free version of the most widely used digital map software, ArcGIS. To demonstrate how Story Maps works, and to get participants started on their own mapping projects, I created a project called “Grayson County Historical Sites.” I thought it would be interesting  to visually display the location of all 130 state historical markers that are located in Grayson County, Texas (home to Austin College for you non-locals) and to create a content-rich presentation connecting the marker locations on the map with textual narration, images, videos, and links to further information about each site. So far I’ve added about a dozen of the sites to my project, but that’s enough to show off a lot of what Story Maps can do. Here’s an embedded version; scroll through the side panel and navigate around the map.

You can get a further sense for the capabilities of Story Maps by visiting their gallery of public projects, where you can browse through dozens of attractive mapping projects organized and searchable by subject matter and template.

The full professional version of ArcGIS is installed on machines in several of the computer labs on campus, including those in the library and the IDEA Center. So that is available for more sophisticated and complex mapping projects. But as a starter experience with GIS, Story Maps offers a surprisingly rich set of features, is free to use, and can be accessed anywhere you have a network connection. It is completely web-based, so there’s no need to download or install anything on your own machine. Projects are created and stored on the ArcGIS website, where users have 2GB of storage. That’s an ample amount, especially because any media files you add to a project are stored elsewhere. You just need to create an account, or use your existing log-in credentials if you already have an ArcGIS account.

The “Map Journal” template is actually one of a number of layouts you can use to combine your map with other content that you bring into the project space. But I think it is the most versatile of those layouts. The presentation area contains two primary spaces: the “main stage,” where your map is displayed, and the “side panel,” which holds the content and material that you connect to the map. There is a flexible set of tools that allows you to create dynamic interactions between the side panel content and the content (location points, shaded regions, etc.) on the map. I’ve included a number of these features in my example project above. Projects can be kept private or made public via a URL to a location on the ArcGIS website. In addition, projects can be easily embedded on other websites, which is what I have done here.

For this example, I’ve pulled in material from a variety of sources on the web. I started with the historical information section on the county’s website, and as I explored the information there I imagined how much more effective the presentation would be with a visually appealing format such as Story Maps. I searched for other resources as well, using Google’s image search for photos, filtering the results to return only those “labeled for noncommercial reuse.” I also searched on the photo repository site Flickr and found images with Creative Commons licenses. Of course, I could have created my own media, but I didn’t have the time right now to do that. The text of the sections in the side panel is taken from the historical markers themselves.

Now it’s possible that such a map project already existed somewhere online…I didn’t find one. And when you use maps in a class, you might well make use of already existing maps and map projects. But there is a value in creating your own, and in having your students do so. For students in particular, to actually build the map and the associated content is a generative act of learning, meaning that because they have actually constructed the project rather than simply looked at someone else’s version of it, they are far more likely to have created the knowledge structures in their minds that will persist in long-term memory.

As with all web-based projects, there are several issues to keep in mind. You need the appropriate permissions, attributions, and credits for any content, such as images and videos, that you bring into the project. Also, because all media used in the project are stored across various web servers and repositories and accessed by URLs, any change in their location or address will cause them to disappear from the project unless you update the address. And of course you need a reliable internet connection to work on and view the project.

If you’re interested in learning more and weren’t able to make the workshop this week, just let me know and we’ll make some time to get you up and running. I’ve also created a workflow guide to the main steps of the process, and there are also tutorials on the Story Maps site. We look forward to featuring faculty and student map projects here on DP@AC!

Where It’s At: Basic Digital Mapping for Your Class

This week’s Digital Pedagogy workshop, “Where It’s At: Basic Digital Maps for Your Class,” will occur Tuesday, October 13, from 4:30–5:30 pm, with a repeat on Wednesday, October 14, from 11:00 am–noon. The location is the library computer lab (Abell 208).

Google-maps-in-education.001-001-2lr147f

Most of us are used to getting driving directions and other geographical information from digital applications on our devices. But you may not have thought as much about how mapping projects can be effective elements of teaching and learning. Now, sometimes we use the term “map” in a broader sense to refer to any representation of content in graphical form; thus there are “mind maps” and “concept maps,” for example. But in the more specific sense, maps are used to present data and information that can be connected to spatial coordinates of latitude and longitude. Across the curriculum there are many possibilities for visualizing content with maps, bringing about deeper insights and more effective learning in the subject matter.

The term “Geographical Information Systems” (GIS) refers to the category of applications and practices involved in mapping projects. These projects, and the associated tools needed to produce them, range widely in complexity. The most commonly used professional GIS tool is ArcGIS, which is installed on computers in a number of workstation areas here at Austin College, including the library and the Idea Center. One of our Mellon grant recipients, political science professor Don Rodgers, is leading a project that utilizes ArcGIS in the Social Entrepreneurship for Poverty Alleviation (SEPA) initiative, a collaborative venture between Austin College and the Texoma Council of Governments.

While ArcGIS is the current standard for GIS software, its use involves a significant level of training and cost. Fortunately, there are more accessible resources at hand if you are interested in incorporating mapping projects and assignments in your courses. For starters, there’s Google Maps (and Google Earth), which is more than just a navigational app on your phone. As Adeline Koh recently observed in an article on digital pedagogy,

Starting with Google Maps to integrate digital humanities [and other liberal arts] in the classroom is relatively painless, easy and free. The tool is easy to navigate, and as many students are already familiar with the Google interface, this familiarity helps them to get to the meat of the assignment more quickly. Instructors interested in exploring mapping projects should thus probably start with this tool. While much more sophisticated projects involving GIS and visualization software are possible, they require considerably more investment in terms of course time and resources.

Another application that is free to use and worth considering is Story Maps, created by ESRI, the same company behind ArcGIS. Story Maps offers a wide range of attractive mapping features; for an extensive gallery of projects created with Story Maps, peruse their gallery of showcase projects, organized by topic.

Both Google Maps and Story Maps allow you to embed narrative text, images, and mulitmedia content into a mapping platform in order to create rich spatial visualizations of your material. The projects can be created collaboratively, thus giving rise to the practice of “social mapping.” For one interesting example of an ongoing collaborative social mapping enterprise, check out some of the projects at Historypin.org.

At this week’s session, we’ll brainstorm ideas for incorporating mapping projects in your class and work together on a simple project that will demonstrate how you can use some of these basic mapping tools. Looking forward to seeing you there.

Curated Resources

css.php